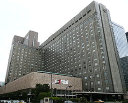
Fujita Kanko Inc
TSE:9722


| US |

|
Johnson & Johnson
NYSE:JNJ
|
Pharmaceuticals
|
| US |

|
Berkshire Hathaway Inc
NYSE:BRK.A
|
Financial Services
|
| US |

|
Bank of America Corp
NYSE:BAC
|
Banking
|
| US |

|
Mastercard Inc
NYSE:MA
|
Technology
|
| US |

|
UnitedHealth Group Inc
NYSE:UNH
|
Health Care
|
| US |

|
Exxon Mobil Corp
NYSE:XOM
|
Energy
|
| US |

|
Pfizer Inc
NYSE:PFE
|
Pharmaceuticals
|
| US |

|
Palantir Technologies Inc
NYSE:PLTR
|
Technology
|
| US |

|
Nike Inc
NYSE:NKE
|
Textiles, Apparel & Luxury Goods
|
| US |

|
Visa Inc
NYSE:V
|
Technology
|
| CN |

|
Alibaba Group Holding Ltd
NYSE:BABA
|
Retail
|
| US |

|
3M Co
NYSE:MMM
|
Industrial Conglomerates
|
| US |

|
JPMorgan Chase & Co
NYSE:JPM
|
Banking
|
| US |

|
Coca-Cola Co
NYSE:KO
|
Beverages
|
| US |

|
Walmart Inc
NYSE:WMT
|
Retail
|
| US |

|
Verizon Communications Inc
NYSE:VZ
|
Telecommunication
|
Utilize notes to systematically review your investment decisions. By reflecting on past outcomes, you can discern effective strategies and identify those that underperformed. This continuous feedback loop enables you to adapt and refine your approach, optimizing for future success.
Each note serves as a learning point, offering insights into your decision-making processes. Over time, you'll accumulate a personalized database of knowledge, enhancing your ability to make informed decisions quickly and effectively.
With a comprehensive record of your investment history at your fingertips, you can compare current opportunities against past experiences. This not only bolsters your confidence but also ensures that each decision is grounded in a well-documented rationale.
Do you really want to delete this note?
This action cannot be undone.

| 52 Week Range |
5 370
9 970
|
| Price Target |
|
We'll email you a reminder when the closing price reaches JPY.
Choose the stock you wish to monitor with a price alert.

|
Johnson & Johnson
NYSE:JNJ
|
US |

|
Berkshire Hathaway Inc
NYSE:BRK.A
|
US |

|
Bank of America Corp
NYSE:BAC
|
US |

|
Mastercard Inc
NYSE:MA
|
US |

|
UnitedHealth Group Inc
NYSE:UNH
|
US |

|
Exxon Mobil Corp
NYSE:XOM
|
US |

|
Pfizer Inc
NYSE:PFE
|
US |

|
Palantir Technologies Inc
NYSE:PLTR
|
US |

|
Nike Inc
NYSE:NKE
|
US |

|
Visa Inc
NYSE:V
|
US |

|
Alibaba Group Holding Ltd
NYSE:BABA
|
CN |

|
3M Co
NYSE:MMM
|
US |

|
JPMorgan Chase & Co
NYSE:JPM
|
US |

|
Coca-Cola Co
NYSE:KO
|
US |

|
Walmart Inc
NYSE:WMT
|
US |

|
Verizon Communications Inc
NYSE:VZ
|
US |
This alert will be permanently deleted.
 Fujita Kanko Inc
 Fujita Kanko Inc
Net Income
Fujita Kanko Inc
Net Income Peer Comparison
Competitors Analysis
Latest Figures & CAGR of Competitors

| Company | Net Income | CAGR 3Y | CAGR 5Y | CAGR 10Y | ||
|---|---|---|---|---|---|---|

|
Fujita Kanko Inc
TSE:9722
|
Net Income
¥8.6B
|
CAGR 3-Years
-13%
|
CAGR 5-Years
49%
|
CAGR 10-Years
20%
|
|

|
H.I.S. Co Ltd
TSE:9603
|
Net Income
¥8.7B
|
CAGR 3-Years
N/A
|
CAGR 5-Years
-16%
|
CAGR 10-Years
-6%
|
|

|
Resorttrust Inc
TSE:4681
|
Net Income
¥25.6B
|
CAGR 3-Years
N/A
|
CAGR 5-Years
4%
|
CAGR 10-Years
3%
|
|

|
Kyoritsu Maintenance Co Ltd
TSE:9616
|
Net Income
¥20.8B
|
CAGR 3-Years
N/A
|
CAGR 5-Years
6%
|
CAGR 10-Years
11%
|
|

|
KNT-CT Holdings Co Ltd
TSE:9726
|
Net Income
¥7B
|
CAGR 3-Years
N/A
|
CAGR 5-Years
20%
|
CAGR 10-Years
6%
|
|

|
Imperial Hotel Ltd
TSE:9708
|
Net Income
¥2.8B
|
CAGR 3-Years
N/A
|
CAGR 5-Years
-12%
|
CAGR 10-Years
-3%
|
|
Fujita Kanko Inc
Glance View
Fujita Kanko, Inc. engages in the management of hotels, restaurants, banquets, wedding and leisure activities. The company is headquartered in Bunkyo-Ku, Tokyo-To and currently employs 1,158 full-time employees. The firm operates in three business segments. The WHG segment operates accommodation-based hotels business. The Resorts segment operates resort hotels and leisure business. The Luxury and Banquet segment operates wedding, banquet, restaurants, hotels, golf, flower decoration, garden management and video business. The others business includes cleaning management, real estate management, operation contracting and other businesses.

See Also
What is Fujita Kanko Inc's Net Income?
Net Income
8.6B
JPY
Based on the financial report for Sep 30, 2024, Fujita Kanko Inc's Net Income amounts to 8.6B JPY.
What is Fujita Kanko Inc's Net Income growth rate?
Net Income CAGR 10Y
20%
The average annual Net Income growth rates for Fujita Kanko Inc have been -13% over the past three years , 49% over the past five years , and 20% over the past ten years .


 You don't have any saved screeners yet