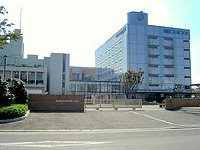
Futaba Corp
TSE:6986


| US |

|
Johnson & Johnson
NYSE:JNJ
|
Pharmaceuticals
|
| US |

|
Berkshire Hathaway Inc
NYSE:BRK.A
|
Financial Services
|
| US |

|
Bank of America Corp
NYSE:BAC
|
Banking
|
| US |

|
Mastercard Inc
NYSE:MA
|
Technology
|
| US |

|
UnitedHealth Group Inc
NYSE:UNH
|
Health Care
|
| US |

|
Exxon Mobil Corp
NYSE:XOM
|
Energy
|
| US |

|
Pfizer Inc
NYSE:PFE
|
Pharmaceuticals
|
| US |

|
Palantir Technologies Inc
NYSE:PLTR
|
Technology
|
| US |

|
Nike Inc
NYSE:NKE
|
Textiles, Apparel & Luxury Goods
|
| US |

|
Visa Inc
NYSE:V
|
Technology
|
| CN |

|
Alibaba Group Holding Ltd
NYSE:BABA
|
Retail
|
| US |

|
3M Co
NYSE:MMM
|
Industrial Conglomerates
|
| US |

|
JPMorgan Chase & Co
NYSE:JPM
|
Banking
|
| US |

|
Coca-Cola Co
NYSE:KO
|
Beverages
|
| US |

|
Walmart Inc
NYSE:WMT
|
Retail
|
| US |

|
Verizon Communications Inc
NYSE:VZ
|
Telecommunication
|
Utilize notes to systematically review your investment decisions. By reflecting on past outcomes, you can discern effective strategies and identify those that underperformed. This continuous feedback loop enables you to adapt and refine your approach, optimizing for future success.
Each note serves as a learning point, offering insights into your decision-making processes. Over time, you'll accumulate a personalized database of knowledge, enhancing your ability to make informed decisions quickly and effectively.
With a comprehensive record of your investment history at your fingertips, you can compare current opportunities against past experiences. This not only bolsters your confidence but also ensures that each decision is grounded in a well-documented rationale.
Do you really want to delete this note?
This action cannot be undone.

| 52 Week Range |
435
658
|
| Price Target |
|
We'll email you a reminder when the closing price reaches JPY.
Choose the stock you wish to monitor with a price alert.

|
Johnson & Johnson
NYSE:JNJ
|
US |

|
Berkshire Hathaway Inc
NYSE:BRK.A
|
US |

|
Bank of America Corp
NYSE:BAC
|
US |

|
Mastercard Inc
NYSE:MA
|
US |

|
UnitedHealth Group Inc
NYSE:UNH
|
US |

|
Exxon Mobil Corp
NYSE:XOM
|
US |

|
Pfizer Inc
NYSE:PFE
|
US |

|
Palantir Technologies Inc
NYSE:PLTR
|
US |

|
Nike Inc
NYSE:NKE
|
US |

|
Visa Inc
NYSE:V
|
US |

|
Alibaba Group Holding Ltd
NYSE:BABA
|
CN |

|
3M Co
NYSE:MMM
|
US |

|
JPMorgan Chase & Co
NYSE:JPM
|
US |

|
Coca-Cola Co
NYSE:KO
|
US |

|
Walmart Inc
NYSE:WMT
|
US |

|
Verizon Communications Inc
NYSE:VZ
|
US |
This alert will be permanently deleted.
 Futaba Corp
 Futaba Corp
Gross Profit
Futaba Corp
Gross Profit Peer Comparison
Competitors Analysis
Latest Figures & CAGR of Competitors

| Company | Gross Profit | CAGR 3Y | CAGR 5Y | CAGR 10Y | ||
|---|---|---|---|---|---|---|

|
Futaba Corp
TSE:6986
|
Gross Profit
¥9B
|
CAGR 3-Years
1%
|
CAGR 5-Years
-6%
|
CAGR 10-Years
-4%
|
|

|
Nidec Corp
TSE:6594
|
Gross Profit
¥509.5B
|
CAGR 3-Years
9%
|
CAGR 5-Years
10%
|
CAGR 10-Years
9%
|
|

|
Fuji Electric Co Ltd
TSE:6504
|
Gross Profit
¥311.9B
|
CAGR 3-Years
10%
|
CAGR 5-Years
6%
|
CAGR 10-Years
5%
|
|
|
F
|
Furukawa Electric Co Ltd
TSE:5801
|
Gross Profit
¥183.8B
|
CAGR 3-Years
8%
|
CAGR 5-Years
3%
|
CAGR 10-Years
4%
|
|

|
Mabuchi Motor Co Ltd
TSE:6592
|
Gross Profit
¥53B
|
CAGR 3-Years
10%
|
CAGR 5-Years
5%
|
CAGR 10-Years
5%
|
|

|
Fujikura Ltd
TSE:5803
|
Gross Profit
¥201.2B
|
CAGR 3-Years
19%
|
CAGR 5-Years
12%
|
CAGR 10-Years
7%
|
|
Futaba Corp
Glance View
Futaba Corp. engages in the manufacture and sale of electronic components and equipment, and machinery and tools It operates through the segments: Electronic Device-related Business and Machinery and Tooling Business. The company is headquartered in Mobara-Shi, Chiba-Ken and currently employs 4,111 full-time employees. The firm operates in two business segments. The Electronic Device segment is engaged in the manufacture and sale of fluorescent display tubes, organic Electroluminescence (EL) display products, touch sensors, composite modules, industrial radio control equipment, hobby radio control equipment and others. The Production Equipment segment offers plate products, mold equipment, molding rationalization equipment.

See Also
What is Futaba Corp's Gross Profit?
Gross Profit
9B
JPY
Based on the financial report for Sep 30, 2024, Futaba Corp's Gross Profit amounts to 9B JPY.
What is Futaba Corp's Gross Profit growth rate?
Gross Profit CAGR 10Y
-4%
Over the last year, the Gross Profit growth was 5%. The average annual Gross Profit growth rates for Futaba Corp have been 1% over the past three years , -6% over the past five years , and -4% over the past ten years .


 You don't have any saved screeners yet
