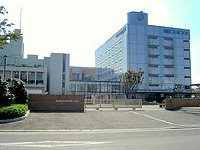
Mabuchi Motor Co Ltd
TSE:6592


Utilize notes to systematically review your investment decisions. By reflecting on past outcomes, you can discern effective strategies and identify those that underperformed. This continuous feedback loop enables you to adapt and refine your approach, optimizing for future success.
Each note serves as a learning point, offering insights into your decision-making processes. Over time, you'll accumulate a personalized database of knowledge, enhancing your ability to make informed decisions quickly and effectively.
With a comprehensive record of your investment history at your fingertips, you can compare current opportunities against past experiences. This not only bolsters your confidence but also ensures that each decision is grounded in a well-documented rationale.
Do you really want to delete this note?
This action cannot be undone.

| 52 Week Range |
1 932
984 430.9598
|
| Price Target |
|
We'll email you a reminder when the closing price reaches JPY.
Choose the stock you wish to monitor with a price alert.
This alert will be permanently deleted.
 Mabuchi Motor Co Ltd
 Mabuchi Motor Co Ltd
Total Assets
Mabuchi Motor Co Ltd
Total Assets Peer Comparison
Competitors Analysis
Latest Figures & CAGR of Competitors

| Company | Total Assets | CAGR 3Y | CAGR 5Y | CAGR 10Y | ||
|---|---|---|---|---|---|---|

|
Mabuchi Motor Co Ltd
TSE:6592
|
Total Assets
¥367.3B
|
CAGR 3-Years
10%
|
CAGR 5-Years
7%
|
CAGR 10-Years
5%
|
|

|
Nidec Corp
TSE:6594
|
Total Assets
¥3.2T
|
CAGR 3-Years
10%
|
CAGR 5-Years
10%
|
CAGR 10-Years
10%
|
|

|
Fuji Electric Co Ltd
TSE:6504
|
Total Assets
¥1.2T
|
CAGR 3-Years
6%
|
CAGR 5-Years
5%
|
CAGR 10-Years
5%
|
|
|
F
|
Furukawa Electric Co Ltd
TSE:5801
|
Total Assets
¥975.8B
|
CAGR 3-Years
5%
|
CAGR 5-Years
4%
|
CAGR 10-Years
3%
|
|

|
GS Yuasa Corp
TSE:6674
|
Total Assets
¥665.5B
|
CAGR 3-Years
15%
|
CAGR 5-Years
12%
|
CAGR 10-Years
7%
|
|

|
Fujikura Ltd
TSE:5803
|
Total Assets
¥732B
|
CAGR 3-Years
8%
|
CAGR 5-Years
2%
|
CAGR 10-Years
3%
|
|
Mabuchi Motor Co Ltd
Glance View
Mabuchi Motor Co., Ltd. engages in the manufacture and sale of electric motors. The company is headquartered in Matsudo-Shi, Chiba-Ken and currently employs 20,894 full-time employees. Its automotive electrical equipment are used in car mirrors, door locks, dampers for air conditioning, power windows, power sheets, collimating equipment for headlights, lumbar supports and others. Its consumer goods and business machine are used in shavers, hair clippers, hair removal machines, toothbrushes, hair dryers, impact wrenches, circular saws, tools, inkjet printers, copiers, multifunction peripheral (MFP), laser printers and others.

See Also
What is Mabuchi Motor Co Ltd's Total Assets?
Total Assets
367.3B
JPY
Based on the financial report for Jun 30, 2024, Mabuchi Motor Co Ltd's Total Assets amounts to 367.3B JPY.
What is Mabuchi Motor Co Ltd's Total Assets growth rate?
Total Assets CAGR 10Y
5%
Over the last year, the Total Assets growth was 10%. The average annual Total Assets growth rates for Mabuchi Motor Co Ltd have been 10% over the past three years , 7% over the past five years , and 5% over the past ten years .


 You don't have any saved screeners yet
