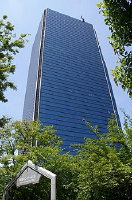
Sanwa Holdings Corp
TSE:5929

| US |

|
Johnson & Johnson
NYSE:JNJ
|
Pharmaceuticals
|
| US |

|
Berkshire Hathaway Inc
NYSE:BRK.A
|
Financial Services
|
| US |

|
Bank of America Corp
NYSE:BAC
|
Banking
|
| US |

|
Mastercard Inc
NYSE:MA
|
Technology
|
| US |

|
UnitedHealth Group Inc
NYSE:UNH
|
Health Care
|
| US |

|
Exxon Mobil Corp
NYSE:XOM
|
Energy
|
| US |

|
Pfizer Inc
NYSE:PFE
|
Pharmaceuticals
|
| US |

|
Palantir Technologies Inc
NYSE:PLTR
|
Technology
|
| US |

|
Nike Inc
NYSE:NKE
|
Textiles, Apparel & Luxury Goods
|
| US |

|
Visa Inc
NYSE:V
|
Technology
|
| CN |

|
Alibaba Group Holding Ltd
NYSE:BABA
|
Retail
|
| US |

|
3M Co
NYSE:MMM
|
Industrial Conglomerates
|
| US |

|
JPMorgan Chase & Co
NYSE:JPM
|
Banking
|
| US |

|
Coca-Cola Co
NYSE:KO
|
Beverages
|
| US |

|
Walmart Inc
NYSE:WMT
|
Retail
|
| US |

|
Verizon Communications Inc
NYSE:VZ
|
Telecommunication
|
Utilize notes to systematically review your investment decisions. By reflecting on past outcomes, you can discern effective strategies and identify those that underperformed. This continuous feedback loop enables you to adapt and refine your approach, optimizing for future success.
Each note serves as a learning point, offering insights into your decision-making processes. Over time, you'll accumulate a personalized database of knowledge, enhancing your ability to make informed decisions quickly and effectively.
With a comprehensive record of your investment history at your fingertips, you can compare current opportunities against past experiences. This not only bolsters your confidence but also ensures that each decision is grounded in a well-documented rationale.
Do you really want to delete this note?
This action cannot be undone.

| 52 Week Range |
2 148.5
4 655
|
| Price Target |
|
We'll email you a reminder when the closing price reaches JPY.
Choose the stock you wish to monitor with a price alert.

|
Johnson & Johnson
NYSE:JNJ
|
US |

|
Berkshire Hathaway Inc
NYSE:BRK.A
|
US |

|
Bank of America Corp
NYSE:BAC
|
US |

|
Mastercard Inc
NYSE:MA
|
US |

|
UnitedHealth Group Inc
NYSE:UNH
|
US |

|
Exxon Mobil Corp
NYSE:XOM
|
US |

|
Pfizer Inc
NYSE:PFE
|
US |

|
Palantir Technologies Inc
NYSE:PLTR
|
US |

|
Nike Inc
NYSE:NKE
|
US |

|
Visa Inc
NYSE:V
|
US |

|
Alibaba Group Holding Ltd
NYSE:BABA
|
CN |

|
3M Co
NYSE:MMM
|
US |

|
JPMorgan Chase & Co
NYSE:JPM
|
US |

|
Coca-Cola Co
NYSE:KO
|
US |

|
Walmart Inc
NYSE:WMT
|
US |

|
Verizon Communications Inc
NYSE:VZ
|
US |
This alert will be permanently deleted.
Sanwa Holdings Corp
Net Income
Sanwa Holdings Corp
Net Income Peer Comparison
Competitors Analysis
Latest Figures & CAGR of Competitors
| Company | Net Income | CAGR 3Y | CAGR 5Y | CAGR 10Y | ||
|---|---|---|---|---|---|---|
|
S
|
Sanwa Holdings Corp
TSE:5929
|
Net Income
¥64.7B
|
CAGR 3-Years
21%
|
CAGR 5-Years
15%
|
CAGR 10-Years
12%
|
|

|
AGC Inc
TSE:5201
|
Net Income
-¥50.8B
|
CAGR 3-Years
N/A
|
CAGR 5-Years
N/A
|
CAGR 10-Years
N/A
|
|

|
Daikin Industries Ltd
TSE:6367
|
Net Income
¥381.8B
|
CAGR 3-Years
8%
|
CAGR 5-Years
6%
|
CAGR 10-Years
8%
|
|

|
TOTO Ltd
TSE:5332
|
Net Income
¥55.5B
|
CAGR 3-Years
-3%
|
CAGR 5-Years
5%
|
CAGR 10-Years
1%
|
|
|
L
|
Lixil Corp
TSE:5938
|
Net Income
¥8.1B
|
CAGR 3-Years
-48%
|
CAGR 5-Years
-2%
|
CAGR 10-Years
-18%
|
|

|
Takasago Thermal Engineering Co Ltd
TSE:1969
|
Net Income
¥29.6B
|
CAGR 3-Years
27%
|
CAGR 5-Years
7%
|
CAGR 10-Years
12%
|
|
Sanwa Holdings Corp
Glance View
Sanwa Holdings Corporation, a titan in the global building materials sector, has meticulously crafted its empire through a blend of innovation and strategic acquisitions. Rooted in Japan, the company has expanded its reach across Asia, Europe, and North America, establishing itself as a key player in the manufacturing and distribution of door-related products. Sanwa's prowess lies in its ability to seamlessly integrate architectural design with robust functionality, producing a wide array of offerings from garage doors to industrial shutters and automatic doors. This diverse portfolio allows Sanwa to cater to a broad spectrum of customer needs, from residential havens to towering commercial edifices. By constantly investing in technology and R&D, Sanwa maintains a competitive edge, aligning its products with the evolving demands of modern infrastructure. Financially, Sanwa Holdings thrives on its multi-faceted revenue streams, driven by its core business segments: Residential, Commercial, and Overseas. The company harnesses a strategic blend of direct sales and a robust dealership network, bolstered by subsidiaries and joint ventures across various continents. This global footprint not only ensures a steady flow of revenue but also acts as a buffer against regional economic fluctuations. The firm’s commitment to quality and service excellence powers its brand reputation, fostering long-term relationships with architects, contractors, and homeowners alike. Through its adept navigation of local regulations and business practices, Sanwa Holdings skillfully transforms the built environment, turning bricks and mortar into substantial financial gains.
See Also
What is Sanwa Holdings Corp's Net Income?
Net Income
64.7B
JPY
Based on the financial report for Sep 30, 2024, Sanwa Holdings Corp's Net Income amounts to 64.7B JPY.
What is Sanwa Holdings Corp's Net Income growth rate?
Net Income CAGR 10Y
12%
Over the last year, the Net Income growth was 7%. The average annual Net Income growth rates for Sanwa Holdings Corp have been 21% over the past three years , 15% over the past five years , and 12% over the past ten years .


 You don't have any saved screeners yet