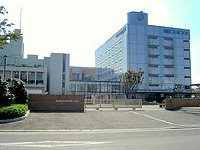
Furukawa Electric Co Ltd
TSE:5801

| US |

|
Johnson & Johnson
NYSE:JNJ
|
Pharmaceuticals
|
| US |

|
Berkshire Hathaway Inc
NYSE:BRK.A
|
Financial Services
|
| US |

|
Bank of America Corp
NYSE:BAC
|
Banking
|
| US |

|
Mastercard Inc
NYSE:MA
|
Technology
|
| US |

|
UnitedHealth Group Inc
NYSE:UNH
|
Health Care
|
| US |

|
Exxon Mobil Corp
NYSE:XOM
|
Energy
|
| US |

|
Pfizer Inc
NYSE:PFE
|
Pharmaceuticals
|
| US |

|
Palantir Technologies Inc
NYSE:PLTR
|
Technology
|
| US |

|
Nike Inc
NYSE:NKE
|
Textiles, Apparel & Luxury Goods
|
| US |

|
Visa Inc
NYSE:V
|
Technology
|
| CN |

|
Alibaba Group Holding Ltd
NYSE:BABA
|
Retail
|
| US |

|
3M Co
NYSE:MMM
|
Industrial Conglomerates
|
| US |

|
JPMorgan Chase & Co
NYSE:JPM
|
Banking
|
| US |

|
Coca-Cola Co
NYSE:KO
|
Beverages
|
| US |

|
Walmart Inc
NYSE:WMT
|
Retail
|
| US |

|
Verizon Communications Inc
NYSE:VZ
|
Telecommunication
|
Utilize notes to systematically review your investment decisions. By reflecting on past outcomes, you can discern effective strategies and identify those that underperformed. This continuous feedback loop enables you to adapt and refine your approach, optimizing for future success.
Each note serves as a learning point, offering insights into your decision-making processes. Over time, you'll accumulate a personalized database of knowledge, enhancing your ability to make informed decisions quickly and effectively.
With a comprehensive record of your investment history at your fingertips, you can compare current opportunities against past experiences. This not only bolsters your confidence but also ensures that each decision is grounded in a well-documented rationale.
Do you really want to delete this note?
This action cannot be undone.

| 52 Week Range |
2 185.5
7 015
|
| Price Target |
|
We'll email you a reminder when the closing price reaches JPY.
Choose the stock you wish to monitor with a price alert.

|
Johnson & Johnson
NYSE:JNJ
|
US |

|
Berkshire Hathaway Inc
NYSE:BRK.A
|
US |

|
Bank of America Corp
NYSE:BAC
|
US |

|
Mastercard Inc
NYSE:MA
|
US |

|
UnitedHealth Group Inc
NYSE:UNH
|
US |

|
Exxon Mobil Corp
NYSE:XOM
|
US |

|
Pfizer Inc
NYSE:PFE
|
US |

|
Palantir Technologies Inc
NYSE:PLTR
|
US |

|
Nike Inc
NYSE:NKE
|
US |

|
Visa Inc
NYSE:V
|
US |

|
Alibaba Group Holding Ltd
NYSE:BABA
|
CN |

|
3M Co
NYSE:MMM
|
US |

|
JPMorgan Chase & Co
NYSE:JPM
|
US |

|
Coca-Cola Co
NYSE:KO
|
US |

|
Walmart Inc
NYSE:WMT
|
US |

|
Verizon Communications Inc
NYSE:VZ
|
US |
This alert will be permanently deleted.
Furukawa Electric Co Ltd
Cash from Operating Activities
Furukawa Electric Co Ltd
Cash from Operating Activities Peer Comparison
Competitors Analysis
Latest Figures & CAGR of Competitors
| Company | Cash from Operating Activities | CAGR 3Y | CAGR 5Y | CAGR 10Y | ||
|---|---|---|---|---|---|---|
|
F
|
Furukawa Electric Co Ltd
TSE:5801
|
Cash from Operating Activities
¥34.7B
|
CAGR 3-Years
N/A
|
CAGR 5-Years
-6%
|
CAGR 10-Years
10%
|
|

|
Nidec Corp
TSE:6594
|
Cash from Operating Activities
¥286.3B
|
CAGR 3-Years
16%
|
CAGR 5-Years
14%
|
CAGR 10-Years
13%
|
|

|
Fuji Electric Co Ltd
TSE:6504
|
Cash from Operating Activities
¥138.8B
|
CAGR 3-Years
26%
|
CAGR 5-Years
29%
|
CAGR 10-Years
9%
|
|

|
GS Yuasa Corp
TSE:6674
|
Cash from Operating Activities
¥52.6B
|
CAGR 3-Years
21%
|
CAGR 5-Years
8%
|
CAGR 10-Years
9%
|
|

|
Mabuchi Motor Co Ltd
TSE:6592
|
Cash from Operating Activities
¥34.6B
|
CAGR 3-Years
24%
|
CAGR 5-Years
10%
|
CAGR 10-Years
10%
|
|

|
Fujikura Ltd
TSE:5803
|
Cash from Operating Activities
¥100.9B
|
CAGR 3-Years
26%
|
CAGR 5-Years
16%
|
CAGR 10-Years
15%
|
|
Furukawa Electric Co Ltd
Glance View
Furukawa Electric Co., Ltd. traces its roots back to the late 19th century's fervent industrial growth in Japan, initially thriving on copper mining and textile manufacturing. Over the years, as industries evolved and diversified, Furukawa Electric adeptly expanded its horizons. Today, the company has metamorphosed into a multifaceted titan in the electrical and electronics sector. With its headquarters based in Tokyo, it plays a pivotal role in the infrastructure that powers modern life. The company's operations are anchored in five core divisions: infrastructure, automotive products, electronics, telecommunications, and energy. These sectors are finely interwoven to capitalize on synergies that maximize efficiency and leverage their extensive expertise in metals and polymers. The heart of the company's revenue model lies in its diversified approach, where it ingeniously capitalizes on its broad product portfolio. Furukawa Electric leverages its advanced materials technology and innovative capabilities to cater to a vast array of industries, from telecommunications—providing critical fiber-optic solutions—to automotive, where it supplies essential components like wire harnesses. This strategic diversification allows Furukawa to navigate market fluctuations with agility and offers a stable financial foundation. Additionally, its ongoing investments in research and development emphasize sustainability and innovation, ensuring it remains at the forefront of technological advancement. Whether through the smart infrastructure solutions or the next-generation automotive components it provides, Furukawa Electric’s profitability stems from its commitment to solving current market needs while anticipating future trends.
See Also
What is Furukawa Electric Co Ltd's Cash from Operating Activities?
Cash from Operating Activities
34.7B
JPY
Based on the financial report for Sep 30, 2024, Furukawa Electric Co Ltd's Cash from Operating Activities amounts to 34.7B JPY.
What is Furukawa Electric Co Ltd's Cash from Operating Activities growth rate?
Cash from Operating Activities CAGR 10Y
10%
Over the last year, the Cash from Operating Activities growth was 8%.


 You don't have any saved screeners yet
