Maruichi Steel Tube Ltd
TSE:5463

 Maruichi Steel Tube Ltd
Cash & Cash Equivalents
Maruichi Steel Tube Ltd
Cash & Cash Equivalents Peer Comparison
Competitors Analysis
Latest Figures & CAGR of Competitors

| Company | Cash & Cash Equivalents | CAGR 3Y | CAGR 5Y | CAGR 10Y | ||
|---|---|---|---|---|---|---|

|
Maruichi Steel Tube Ltd
TSE:5463
|
Cash & Cash Equivalents
¥77.2B
|
CAGR 3-Years
6%
|
CAGR 5-Years
1%
|
CAGR 10-Years
3%
|
|

|
Nippon Steel Corp
TSE:5401
|
Cash & Cash Equivalents
¥640.6B
|
CAGR 3-Years
1%
|
CAGR 5-Years
20%
|
CAGR 10-Years
15%
|
|
|
Y
|
Yamato Kogyo Co Ltd
TSE:5444
|
Cash & Cash Equivalents
¥211.6B
|
CAGR 3-Years
32%
|
CAGR 5-Years
18%
|
CAGR 10-Years
10%
|
|

|
Kobe Steel Ltd
TSE:5406
|
Cash & Cash Equivalents
¥203.4B
|
CAGR 3-Years
2%
|
CAGR 5-Years
4%
|
CAGR 10-Years
5%
|
|

|
JFE Holdings Inc
TSE:5411
|
Cash & Cash Equivalents
¥149.6B
|
CAGR 3-Years
11%
|
CAGR 5-Years
12%
|
CAGR 10-Years
7%
|
|

|
Daido Steel Co Ltd
TSE:5471
|
Cash & Cash Equivalents
¥51.4B
|
CAGR 3-Years
-5%
|
CAGR 5-Years
2%
|
CAGR 10-Years
3%
|
|
Maruichi Steel Tube Ltd
Glance View
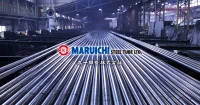
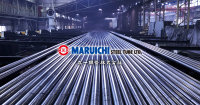
Maruichi Steel Tube Ltd., a distinguished player in the steel industry, carves its niche by transforming raw materials into vital components that power a diverse array of industries. Founded in 1947, the company has steadily advanced its capabilities in manufacturing carbon steel pipes and tubes, which form the backbone of critical infrastructure projects. As Japan navigated post-war reconstruction, Maruichi embraced technological advancement and market expansion, capitalizing on the relentless demand for robust steel products. What sets Maruichi apart is its acute focus on innovation and quality, ensuring that its steel tubes meet the stringent standards required by industries such as construction, automotive, and machinery manufacturing. At its core, Maruichi's business model hinges on efficient production processes, adaptability, and a keen understanding of market needs. By utilizing cutting-edge manufacturing technologies and maintaining a flexible production line, the company effectively responds to fluctuating market demands and economic conditions. The synergy of its domestic and international operations enables Maruichi to maintain a balanced portfolio, with revenues consistently bolstered by exports across North America and Southeast Asia. Anchoring its financial stability is a commitment to sustainability and eco-friendly practices, aligning with global calls for greener industrial processes. Through these strategic initiatives, Maruichi continues to thrive as a resilient and adaptable force in the global steel market.

See Also
What is Maruichi Steel Tube Ltd's Cash & Cash Equivalents?
Cash & Cash Equivalents
77.2B
JPY
Based on the financial report for Dec 31, 2024, Maruichi Steel Tube Ltd's Cash & Cash Equivalents amounts to 77.2B JPY.
What is Maruichi Steel Tube Ltd's Cash & Cash Equivalents growth rate?
Cash & Cash Equivalents CAGR 10Y
3%
Over the last year, the Cash & Cash Equivalents growth was -7%. The average annual Cash & Cash Equivalents growth rates for Maruichi Steel Tube Ltd have been 6% over the past three years , 1% over the past five years , and 3% over the past ten years .


 You don't have any saved screeners yet