Mie Kotsu Group Holdings Inc
TSE:3232

 Mie Kotsu Group Holdings Inc
Cash from Operating Activities
Mie Kotsu Group Holdings Inc
Cash from Operating Activities Peer Comparison
Competitors Analysis
Latest Figures & CAGR of Competitors

| Company | Cash from Operating Activities | CAGR 3Y | CAGR 5Y | CAGR 10Y | ||
|---|---|---|---|---|---|---|

|
Mie Kotsu Group Holdings Inc
TSE:3232
|
Cash from Operating Activities
¥11.8B
|
CAGR 3-Years
14%
|
CAGR 5-Years
9%
|
CAGR 10-Years
-1%
|
|

|
Hitachi Ltd
TSE:6501
|
Cash from Operating Activities
¥963B
|
CAGR 3-Years
9%
|
CAGR 5-Years
10%
|
CAGR 10-Years
13%
|
|

|
Nisshinbo Holdings Inc
TSE:3105
|
Cash from Operating Activities
¥27.3B
|
CAGR 3-Years
-13%
|
CAGR 5-Years
-6%
|
CAGR 10-Years
-2%
|
|

|
Toshiba Corp
TSE:6502
|
Cash from Operating Activities
¥154.9B
|
CAGR 3-Years
N/A
|
CAGR 5-Years
-5%
|
CAGR 10-Years
1%
|
|

|
Noritsu Koki Co Ltd
TSE:7744
|
Cash from Operating Activities
¥30.5B
|
CAGR 3-Years
50%
|
CAGR 5-Years
36%
|
CAGR 10-Years
25%
|
|

|
Keihan Holdings Co Ltd
TSE:9045
|
Cash from Operating Activities
¥53.4B
|
CAGR 3-Years
30%
|
CAGR 5-Years
2%
|
CAGR 10-Years
9%
|
|
Mie Kotsu Group Holdings Inc
Glance View
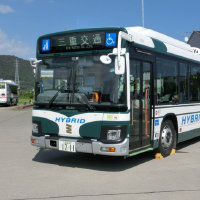
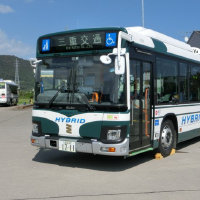
Mie Kotsu Group Holdings, Inc. engages in the management of its subsidiaries which are in the transportation, real estate, and leisure industries. The company is headquartered in Tsu-Shi, Mie-Ken and currently employs 3,338 full-time employees. The company went IPO on 2006-10-01. The Transportation segment is involved in bus, taxi and railway transportation businesses, as well as leasing of asset. The Real Estate segment is involved in the sale, brokerage, leasing, appraisal and management of real estate, as well as construction of house. The Distribution segment is involved in sale of petroleum product, daily goods, truck and bus. The Leisure and Service segment is involved in travel placement, the operation of Japanese-style hotel, business hotel, drive-in, ropeway, golf course and driving school.

See Also
What is Mie Kotsu Group Holdings Inc's Cash from Operating Activities?
Cash from Operating Activities
11.8B
JPY
Based on the financial report for Sep 30, 2024, Mie Kotsu Group Holdings Inc's Cash from Operating Activities amounts to 11.8B JPY.
What is Mie Kotsu Group Holdings Inc's Cash from Operating Activities growth rate?
Cash from Operating Activities CAGR 10Y
-1%
Over the last year, the Cash from Operating Activities growth was 1%. The average annual Cash from Operating Activities growth rates for Mie Kotsu Group Holdings Inc have been 14% over the past three years , 9% over the past five years , and -1% over the past ten years .


 You don't have any saved screeners yet