Viaplay Group AB (publ)
STO:VPLAY B


| US |

|
Johnson & Johnson
NYSE:JNJ
|
Pharmaceuticals
|
| US |

|
Berkshire Hathaway Inc
NYSE:BRK.A
|
Financial Services
|
| US |

|
Bank of America Corp
NYSE:BAC
|
Banking
|
| US |

|
Mastercard Inc
NYSE:MA
|
Technology
|
| US |

|
Abbvie Inc
NYSE:ABBV
|
Biotechnology
|
| US |

|
Pfizer Inc
NYSE:PFE
|
Pharmaceuticals
|
| US |

|
Palantir Technologies Inc
NYSE:PLTR
|
Technology
|
| US |

|
Nike Inc
NYSE:NKE
|
Textiles, Apparel & Luxury Goods
|
| US |

|
Visa Inc
NYSE:V
|
Technology
|
| CN |

|
Alibaba Group Holding Ltd
NYSE:BABA
|
Retail
|
| US |

|
3M Co
NYSE:MMM
|
Industrial Conglomerates
|
| US |

|
JPMorgan Chase & Co
NYSE:JPM
|
Banking
|
| US |

|
Coca-Cola Co
NYSE:KO
|
Beverages
|
| US |

|
Realty Income Corp
NYSE:O
|
Real Estate
|
| US |

|
Walt Disney Co
NYSE:DIS
|
Media
|
| US |

|
PayPal Holdings Inc
NASDAQ:PYPL
|
Technology
|
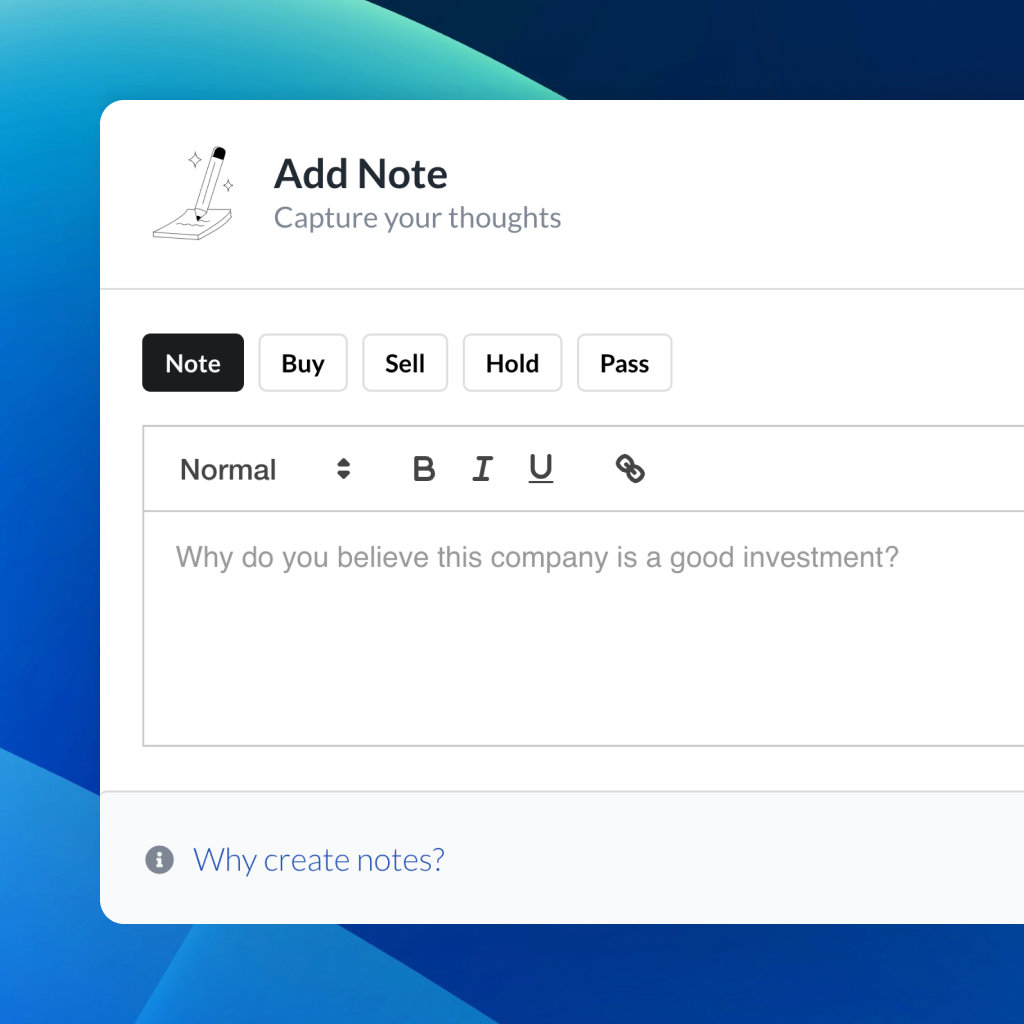
Utilize notes to systematically review your investment decisions. By reflecting on past outcomes, you can discern effective strategies and identify those that underperformed. This continuous feedback loop enables you to adapt and refine your approach, optimizing for future success.
Each note serves as a learning point, offering insights into your decision-making processes. Over time, you'll accumulate a personalized database of knowledge, enhancing your ability to make informed decisions quickly and effectively.
With a comprehensive record of your investment history at your fingertips, you can compare current opportunities against past experiences. This not only bolsters your confidence but also ensures that each decision is grounded in a well-documented rationale.
Do you really want to delete this note?
This action cannot be undone.

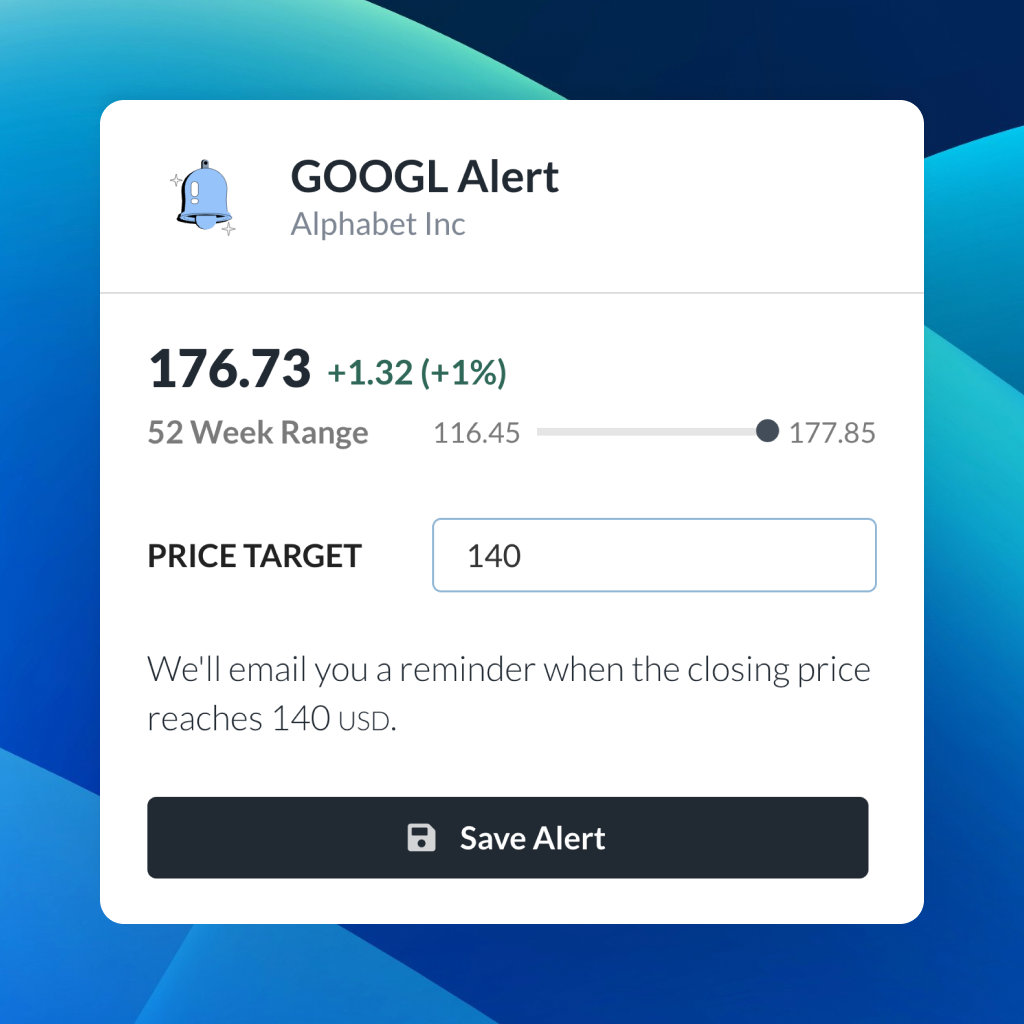
| 52 Week Range |
0.614
68.25
|
| Price Target |
|
We'll email you a reminder when the closing price reaches USD.
Choose the stock you wish to monitor with a price alert.

|
Johnson & Johnson
NYSE:JNJ
|
US |

|
Berkshire Hathaway Inc
NYSE:BRK.A
|
US |

|
Bank of America Corp
NYSE:BAC
|
US |

|
Mastercard Inc
NYSE:MA
|
US |

|
Abbvie Inc
NYSE:ABBV
|
US |

|
Pfizer Inc
NYSE:PFE
|
US |

|
Palantir Technologies Inc
NYSE:PLTR
|
US |

|
Nike Inc
NYSE:NKE
|
US |

|
Visa Inc
NYSE:V
|
US |

|
Alibaba Group Holding Ltd
NYSE:BABA
|
CN |

|
3M Co
NYSE:MMM
|
US |

|
JPMorgan Chase & Co
NYSE:JPM
|
US |

|
Coca-Cola Co
NYSE:KO
|
US |

|
Realty Income Corp
NYSE:O
|
US |

|
Walt Disney Co
NYSE:DIS
|
US |

|
PayPal Holdings Inc
NASDAQ:PYPL
|
US |
This alert will be permanently deleted.
 Viaplay Group AB (publ)
Relative Value
The Relative Value of one
 VPLAY B
stock under the Base Case scenario is
2.1345
SEK.
Compared to the current market price of 0.8086 SEK,
Viaplay Group AB (publ)
is
Undervalued by 62%.
Relative Value is the estimated value of a stock based on various valuation multiples like P/E and EV/EBIT ratios. It offers a quick snapshot of a stock's valuation in relation to its peers and historical norms.

Valuation Multiples
Multiples Across Competitors
VPLAY B Competitors Multiples
Viaplay Group AB (publ) Competitors

| Market Cap | P/S | P/E | EV/EBITDA | EV/EBIT | ||||
|---|---|---|---|---|---|---|---|---|
| SE |

|
Viaplay Group AB (publ)
STO:VPLAY B
|
3.7B SEK | 0.2 | -0.4 | -5.3 | -4 | |
| AR |

|
Grupo Clarin SA
LSE:GCLA
|
29.7B USD | 278.9 | -50 590.1 | 2 144 | 3 192.1 | |
| US |

|
ViacomCBS Inc
NASDAQ:VIAC
|
21.4B USD | 0.8 | 6.5 | 6.9 | 7.5 | |
| US |

|
Fox Corp
NASDAQ:FOXA
|
16.2B USD | 1.2 | 10.4 | 6.9 | 8 | |
| FR |

|
Vivendi SE
PAR:VIV
|
10.5B EUR | 1 | 25.9 | 10.3 | 20 | |
| US |

|
Paramount Global
NASDAQ:PARA
|
7.7B USD | 0.3 | -76.6 | 19.7 | 33.5 | |
| US |

|
Nexstar Media Group Inc
NASDAQ:NXST
|
5.5B USD | 1.1 | 13.5 | 7.1 | 14.7 | |
| LU |

|
RTL Group SA
XETRA:RRTL
|
4.6B EUR | 0.7 | 9.8 | 5.9 | 8.4 | |
| UK |

|
ITV PLC
LSE:ITV
|
3.4B GBP | 0.9 | 16.2 | 8.3 | 11.9 | |
| JP |

|
TBS Holdings Inc
TSE:9401
|
682.1B JPY | 1.7 | 17.8 | 20 | 42.3 | |
| SA |
M
|
MBC Group CJSC
SAU:4072
|
14.2B SAR | 8.3 | 746.5 | -254.5 | -155 |


 You don't have any saved screeners yet
