
Teck Resources Ltd
NYSE:TECK

Decide at what price you'd be comfortable buying and we'll help you stay ready.

|
Johnson & Johnson
NYSE:JNJ
|
US |

|
Berkshire Hathaway Inc
NYSE:BRK.A
|
US |

|
Bank of America Corp
NYSE:BAC
|
US |

|
Mastercard Inc
NYSE:MA
|
US |

|
UnitedHealth Group Inc
NYSE:UNH
|
US |

|
Exxon Mobil Corp
NYSE:XOM
|
US |

|
Pfizer Inc
NYSE:PFE
|
US |

|
Nike Inc
NYSE:NKE
|
US |

|
Visa Inc
NYSE:V
|
US |

|
Alibaba Group Holding Ltd
NYSE:BABA
|
CN |

|
JPMorgan Chase & Co
NYSE:JPM
|
US |

|
Coca-Cola Co
NYSE:KO
|
US |

|
Verizon Communications Inc
NYSE:VZ
|
US |

|
Chevron Corp
NYSE:CVX
|
US |

|
Walt Disney Co
NYSE:DIS
|
US |

|
PayPal Holdings Inc
NASDAQ:PYPL
|
US |
EV/EBIT
Enterprise Value to EBIT (EV/EBIT) ratio compares a company`s total enterprise value to its earnings before interest and taxes. It shows how much investors are paying for each dollar of the company`s earnings, including both equity and debt.
Enterprise Value to EBIT (EV/EBIT) ratio compares a company`s total enterprise value to its earnings before interest and taxes. It shows how much investors are paying for each dollar of the company`s earnings, including both equity and debt.
Valuation Scenarios
If EV/EBIT returns to its 3-Year Average (13.3), the stock would be worth $26.56 (53% downside from current price).
| Scenario | EV/EBIT Value | Implied Price | Upside/Downside |
|---|---|---|---|
| Current Multiple | 28.4 | $56.71 |
0%
|
| 3-Year Average | 13.3 | $26.56 |
-53%
|
| 5-Year Average | 12.1 | $24.2 |
-57%
|
| Industry Average | 13.3 | $26.64 |
-53%
|
| Country Average | 14.5 | $28.88 |
-49%
|
Forward EV/EBIT
Today’s price vs future ebit
| Today's Enterprise Value | EBIT | Forward EV/EBIT | ||
|---|---|---|---|---|
|
$32.4B
|
/ |
Oct 2025
CA$1.5B
|
= |
|
|
$32.4B
|
/ |
Dec 2025
CA$2.3B
|
= |
|
|
$32.4B
|
/ |
Dec 2026
CA$3.8B
|
= |
|
|
$32.4B
|
/ |
Dec 2027
CA$3.9B
|
= |
|
|
$32.4B
|
/ |
Dec 2028
CA$3B
|
= |
|
Forward EV/EBIT shows whether today’s EV/EBIT still looks high or low once future ebit are taken into account.
Peer Comparison
| Market Cap | EV/EBIT | P/E | ||||
|---|---|---|---|---|---|---|
| CA |

|
Teck Resources Ltd
NYSE:TECK
|
27.7B USD | 28.4 | 30.2 | |
| AU |

|
BHP Group Ltd
ASX:BHP
|
282.8B AUD | 9.4 | 19.4 | |
| AU |

|
Rio Tinto Ltd
ASX:RIO
|
280.1B AUD | 11.6 | 20.1 | |
| UK |

|
Rio Tinto PLC
LSE:RIO
|
118.5B GBP | 10.2 | 15.7 | |
| MX |

|
Grupo Mexico SAB de CV
BMV:GMEXICOB
|
1.6T MXN | 10.7 | 18.1 | |
| CH |

|
Glencore PLC
LSE:GLEN
|
64.5B GBP | 36.1 | 235.2 | |
| SA |

|
Saudi Arabian Mining Company SJSC
SAU:1211
|
248.9B SAR | 25.9 | 33.9 | |
| CN |

|
CMOC Group Ltd
SSE:603993
|
433B CNY | 9.9 | 21.1 | |
| UK |

|
Anglo American PLC
LSE:AAL
|
41.9B GBP | 15.9 | -14.8 | |
| CN |
C
|
China Molybdenum Co Ltd
OTC:CMCLF
|
52.8B USD | 8.7 | 18.5 | |
| ZA |
A
|
African Rainbow Minerals Ltd
JSE:ARI
|
45.9B ZAR | -75.7 | 35.6 |
Market Distribution
| Min | 0 |
| 30th Percentile | 10.6 |
| Median | 14.5 |
| 70th Percentile | 20.6 |
| Max | 3 794.4 |
Other Multiples
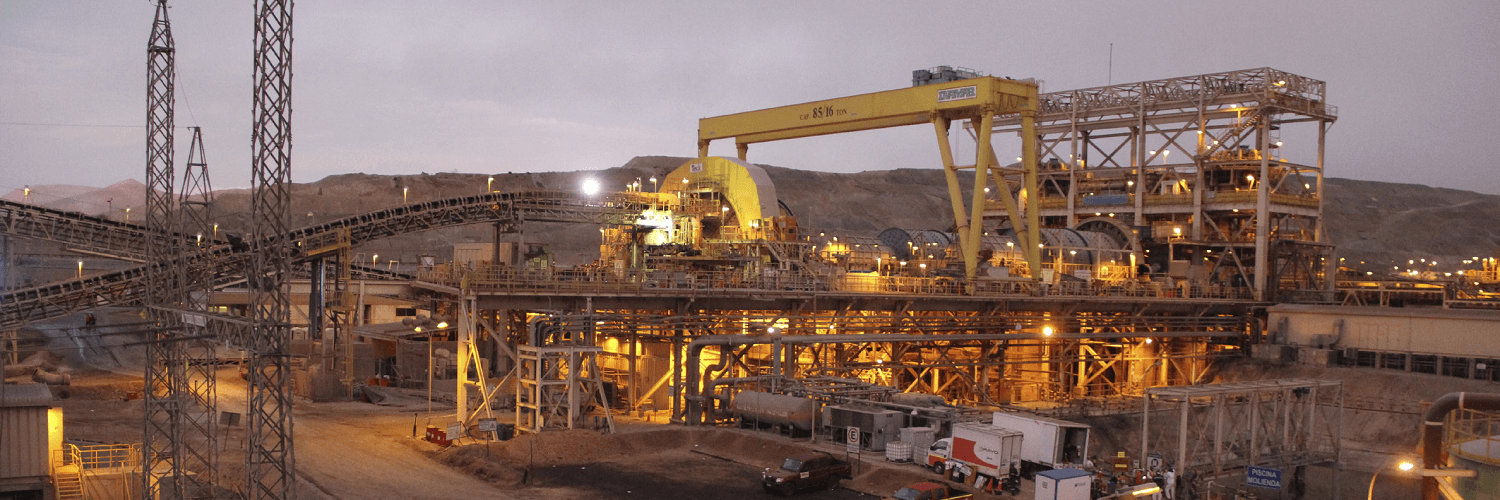
Teck Resources Ltd
Glance View
Teck Resources Ltd. stands as a prominent entity in the realm of natural resources, deeply entrenched in a narrative of extraction and innovation. Founded in the early 20th century, the company's journey mirrors the dynamic history of Canada's mining industry. Headquartered in Vancouver, Teck has evolved from its early days focused on simple zinc mining into a diversified mining giant with a global footprint. Today, the company operates in the domains of copper, coal, zinc, and energy, strategically positioning itself across regions in the Americas, with pivotal operations in Canada, Chile, and the United States. This geographical diversification allows Teck not only to mitigate potential risks associated with singular dependencies but also to capitalize on the wide-ranging opportunities offered by different markets. Central to Teck's operations and profitability is its integrated approach to resource development, where it meticulously oversees the life cycle of mining operations—from exploration and development to extraction and processing. The company primarily profits from the extraction and sale of its core materials: metallurgical coal, used in steelmaking; copper, vital for electrical applications given the rise of renewable energy and electric vehicles; and zinc, essential for corrosion protection. Beyond merely exploiting these natural deposits, Teck invests significantly in sustainable technologies to reduce environmental impact, thus aligning its long-term strategy with both economic gains and corporate responsibility. This balance of innovation and tradition secures its status not just as a mining leader, but as a forward-thinking entity committed to redefining the standards of the industry.
