
DT Midstream Inc
NYSE:DTM

Decide at what price you'd be comfortable buying and we'll help you stay ready.

|
Johnson & Johnson
NYSE:JNJ
|
US |

|
Berkshire Hathaway Inc
NYSE:BRK.A
|
US |

|
Bank of America Corp
NYSE:BAC
|
US |

|
Mastercard Inc
NYSE:MA
|
US |

|
UnitedHealth Group Inc
NYSE:UNH
|
US |

|
Exxon Mobil Corp
NYSE:XOM
|
US |

|
Pfizer Inc
NYSE:PFE
|
US |

|
Nike Inc
NYSE:NKE
|
US |

|
Visa Inc
NYSE:V
|
US |

|
Alibaba Group Holding Ltd
NYSE:BABA
|
CN |

|
JPMorgan Chase & Co
NYSE:JPM
|
US |

|
Coca-Cola Co
NYSE:KO
|
US |

|
Verizon Communications Inc
NYSE:VZ
|
US |

|
Chevron Corp
NYSE:CVX
|
US |

|
Walt Disney Co
NYSE:DIS
|
US |

|
PayPal Holdings Inc
NASDAQ:PYPL
|
US |
EV/EBIT
Enterprise Value to EBIT (EV/EBIT) ratio compares a company`s total enterprise value to its earnings before interest and taxes. It shows how much investors are paying for each dollar of the company`s earnings, including both equity and debt.
Enterprise Value to EBIT (EV/EBIT) ratio compares a company`s total enterprise value to its earnings before interest and taxes. It shows how much investors are paying for each dollar of the company`s earnings, including both equity and debt.
Valuation Scenarios
If EV/EBIT returns to its 3-Year Average (20.6), the stock would be worth $101.71 (23% downside from current price).
| Scenario | EV/EBIT Value | Implied Price | Upside/Downside |
|---|---|---|---|
| Current Multiple | 26.7 | $132.15 |
0%
|
| 3-Year Average | 20.6 | $101.71 |
-23%
|
| 5-Year Average | 17.9 | $88.75 |
-33%
|
| Industry Average | 12.1 | $59.67 |
-55%
|
| Country Average | 19.6 | $97.03 |
-27%
|
Forward EV/EBIT
Today’s price vs future ebit
| Today's Enterprise Value | EBIT | Forward EV/EBIT | ||
|---|---|---|---|---|
|
$17.4B
|
/ |
Jan 2026
$614m
|
= |
|
|
$17.4B
|
/ |
Dec 2026
$698.2m
|
= |
|
|
$17.4B
|
/ |
Dec 2027
$749.8m
|
= |
|
|
$17.4B
|
/ |
Dec 2028
$828.4m
|
= |
|
Forward EV/EBIT shows whether today’s EV/EBIT still looks high or low once future ebit are taken into account.
Peer Comparison
| Market Cap | EV/EBIT | P/E | ||||
|---|---|---|---|---|---|---|
| US |

|
DT Midstream Inc
NYSE:DTM
|
13.4B USD | 26.7 | 29.7 | |
| CA |

|
Enbridge Inc
TSX:ENB
|
157.3B CAD | 22.5 | 22 | |
| US |

|
Williams Companies Inc
NYSE:WMB
|
86.7B USD | 26 | 33.1 | |
| US |

|
Enterprise Products Partners LP
NYSE:EPD
|
79.8B USD | 16.1 | 13.9 | |
| US |

|
Kinder Morgan Inc
NYSE:KMI
|
71.1B USD | 21.5 | 23.3 | |
| US |

|
Energy Transfer LP
NYSE:ET
|
65.1B USD | 14.2 | 15.6 | |
| CA |

|
TC Energy Corp
TSX:TRP
|
86.3B CAD | 21.2 | 25.4 | |
| US |

|
MPLX LP
NYSE:MPLX
|
56.7B USD | 13.3 | 11.6 | |
| US |

|
Cheniere Energy Inc
NYSE:LNG
|
53B USD | 8.3 | 10 | |
| US |

|
ONEOK Inc
NYSE:OKE
|
52.8B USD | 14.5 | 15.5 | |
| US |

|
Targa Resources Corp
NYSE:TRGP
|
49.7B USD | 19.9 | 27 |
Market Distribution
| Min | 0 |
| 30th Percentile | 13.6 |
| Median | 19.6 |
| 70th Percentile | 27.8 |
| Max | 1 826 183.2 |
Other Multiples
DT Midstream Inc
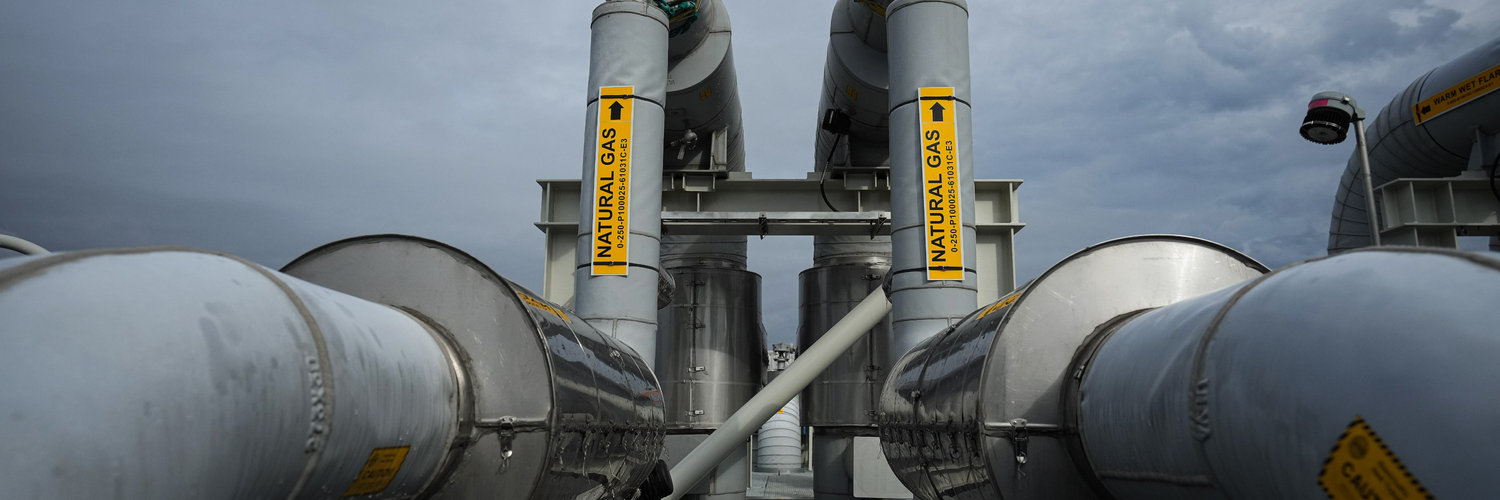
Glance View
DT Midstream Inc. stands as a pivotal player in the realm of energy infrastructure, strategically positioned in the heart of North America's natural gas industry. Emerging from the well-established roots of DTE Energy, the company was spun off in 2021, taking with it a rich lineage of experience and expertise. DT Midstream's operations are intricately woven around the transportation and storage of natural gas, a critical component for ensuring energy reliability and delivery across vast regions. With an extensive network of natural gas pipelines and storage systems, the company effectively connects major supply basins with key markets and customers. This comprehensive infrastructure network enables it to facilitate the seamless movement of gas, providing essential services to various stakeholders including utilities, power plants, and industrial facilities. Revenue generation for DT Midstream is predominantly driven by its fee-based business model, where the company earns from capacity reservations and volumetric throughput. This stable income stream is structured through long-term contracts, insulating the company from the volatile swings of commodity prices. By focusing on expanding and optimizing its existing assets, DT Midstream seeks to capture growth opportunities that align with increasing demand for cleaner energy sources. As natural gas continues to play a significant role in the transition toward a low-carbon future, DT Midstream is poised to maintain and potentially grow its position as a vital conduit within the energy sector, combining strategic operations with forward-thinking initiatives to cater to evolving market needs.
