
Sundial Growers Inc
NASDAQ:SNDL

Decide at what price you'd be comfortable buying and we'll help you stay ready.

|
Johnson & Johnson
NYSE:JNJ
|
US |

|
Berkshire Hathaway Inc
NYSE:BRK.A
|
US |

|
Bank of America Corp
NYSE:BAC
|
US |

|
Mastercard Inc
NYSE:MA
|
US |

|
UnitedHealth Group Inc
NYSE:UNH
|
US |

|
Exxon Mobil Corp
NYSE:XOM
|
US |

|
Pfizer Inc
NYSE:PFE
|
US |

|
Nike Inc
NYSE:NKE
|
US |

|
Visa Inc
NYSE:V
|
US |

|
Alibaba Group Holding Ltd
NYSE:BABA
|
CN |

|
JPMorgan Chase & Co
NYSE:JPM
|
US |

|
Coca-Cola Co
NYSE:KO
|
US |

|
Verizon Communications Inc
NYSE:VZ
|
US |

|
Chevron Corp
NYSE:CVX
|
US |

|
Walt Disney Co
NYSE:DIS
|
US |

|
PayPal Holdings Inc
NASDAQ:PYPL
|
US |
P/OCF
Price to Operating Cash Flow (P/OCF) ratio compares a company`s market value to the cash it generates from its core operations.
Price to Operating Cash Flow (P/OCF) ratio compares a company`s market value to the cash it generates from its core operations.
Valuation Scenarios
If P/OCF returns to its 3-Year Average (8.5), the stock would be worth $1.64 (7% upside from current price).
| Scenario | P/OCF Value | Implied Price | Upside/Downside |
|---|---|---|---|
| Current Multiple | 7.9 | $1.53 |
0%
|
| 3-Year Average | 8.5 | $1.64 |
+7%
|
| Industry Average | 10.4 | $2 |
+31%
|
| Country Average | 10.9 | $2.12 |
+39%
|
Forward P/OCF
Today’s price vs future operating cash flow
Peer Comparison
| Market Cap | P/OCF | P/E | ||||
|---|---|---|---|---|---|---|
| CA |

|
Sundial Growers Inc
NASDAQ:SNDL
|
402.9m USD | 7.9 | -35.5 | |
| US |

|
Eli Lilly and Co
NYSE:LLY
|
867B USD | 51.6 | 42 | |
| US |
|
Johnson & Johnson
NYSE:JNJ
|
555.4B USD | 22.6 | 26.4 | |
| CH |

|
Roche Holding AG
SIX:ROG
|
248.4B CHF | 13.2 | 19.3 | |
| UK |

|
AstraZeneca PLC
LSE:AZN
|
224.8B GBP | 20.4 | 29.1 | |
| CH |

|
Novartis AG
SIX:NOVN
|
221.8B CHF | 14.6 | 20 | |
| US |

|
Merck & Co Inc
NYSE:MRK
|
283.6B USD | 17.2 | 15.5 | |
| IE |
E
|
Endo International PLC
LSE:0Y5F
|
244.4B USD | 907.7 | -83.6 | |
| DK |

|
Novo Nordisk A/S
CSE:NOVO B
|
1.1T DKK | 9.2 | 10.7 | |
| US |
|
Pfizer Inc
NYSE:PFE
|
151.6B USD | 13 | 19.5 | |
| US |

|
Bristol-Myers Squibb Co
NYSE:BMY
|
118.8B USD | 8.4 | 16.8 |
Market Distribution
| Min | 0.1 |
| 30th Percentile | 7.2 |
| Median | 10.9 |
| 70th Percentile | 17 |
| Max | 26 053.9 |
Other Multiples
Sundial Growers Inc
Glance View
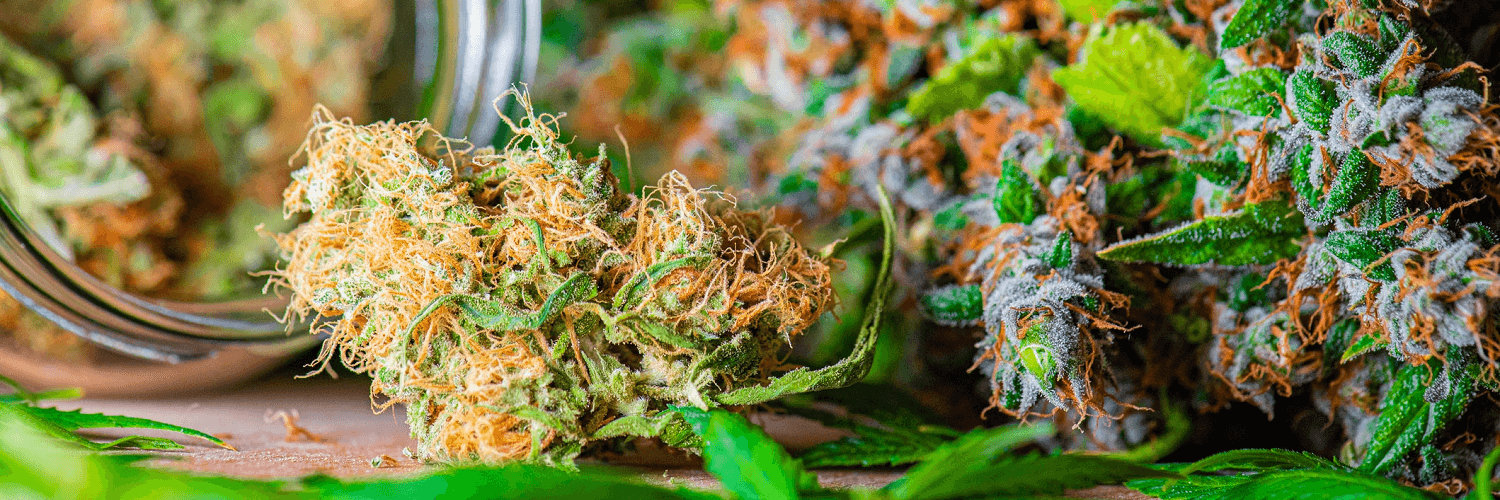
Sundial Growers, Inc. is a licensed producer that crafts small-batch cannabis using state-of-the-art indoor facilities. The company is headquartered in Calgary, Alberta and currently employs 394 full-time employees. The company went IPO on 2019-08-01. The Company’s segments include Cannabis Operations, Cannabis and Liquor Retail and Investment Operations. Its portfolio brands includes Top Leaf, Sundial Cannabis, Palmetto, and Grasslands. The firm operates the Spiritleaf retail banner. The firm also operates a private-sector retailers of alcohol in North America and Canada by number of stores, operating locations in Alberta and British Columbia. Its investment operations seek to arrange strategic capital through direct and indirect investments and partnerships throughout the global cannabis industry.
