Bega Cheese Ltd
ASX:BGA
 Bega Cheese Ltd
EPS (Diluted)
Bega Cheese Ltd
EPS (Diluted)
Bega Cheese Ltd
EPS (Diluted) Peer Comparison
Competitors Analysis
Latest Figures & CAGR of Competitors
| Company | EPS (Diluted) | CAGR 3Y | CAGR 5Y | CAGR 10Y | ||
|---|---|---|---|---|---|---|
|
|
Bega Cheese Ltd
ASX:BGA
|
EPS (Diluted)
AU$0
|
CAGR 3-Years
44%
|
CAGR 5-Years
-28%
|
CAGR 10-Years
-14%
|
|
|
Australian Agricultural Company Ltd
ASX:AAC
|
EPS (Diluted)
AU$0
|
CAGR 3-Years
-21%
|
CAGR 5-Years
2%
|
CAGR 10-Years
-4%
|
|

|
Ricegrowers Ltd
ASX:SGLLV
|
EPS (Diluted)
AU$1
|
CAGR 3-Years
12%
|
CAGR 5-Years
19%
|
CAGR 10-Years
3%
|
|

|
Angel Seafood Holdings Ltd
ASX:AS1
|
EPS (Diluted)
AU$0
|
CAGR 3-Years
N/A
|
CAGR 5-Years
N/A
|
CAGR 10-Years
N/A
|
|

|
Inghams Group Ltd
ASX:ING
|
EPS (Diluted)
AU$0
|
CAGR 3-Years
39%
|
CAGR 5-Years
17%
|
CAGR 10-Years
N/A
|
|

|
Cobram Estate Olives Ltd
ASX:CBO
|
EPS (Diluted)
AU$0
|
CAGR 3-Years
N/A
|
CAGR 5-Years
N/A
|
CAGR 10-Years
N/A
|
|
Bega Cheese Ltd
Glance View
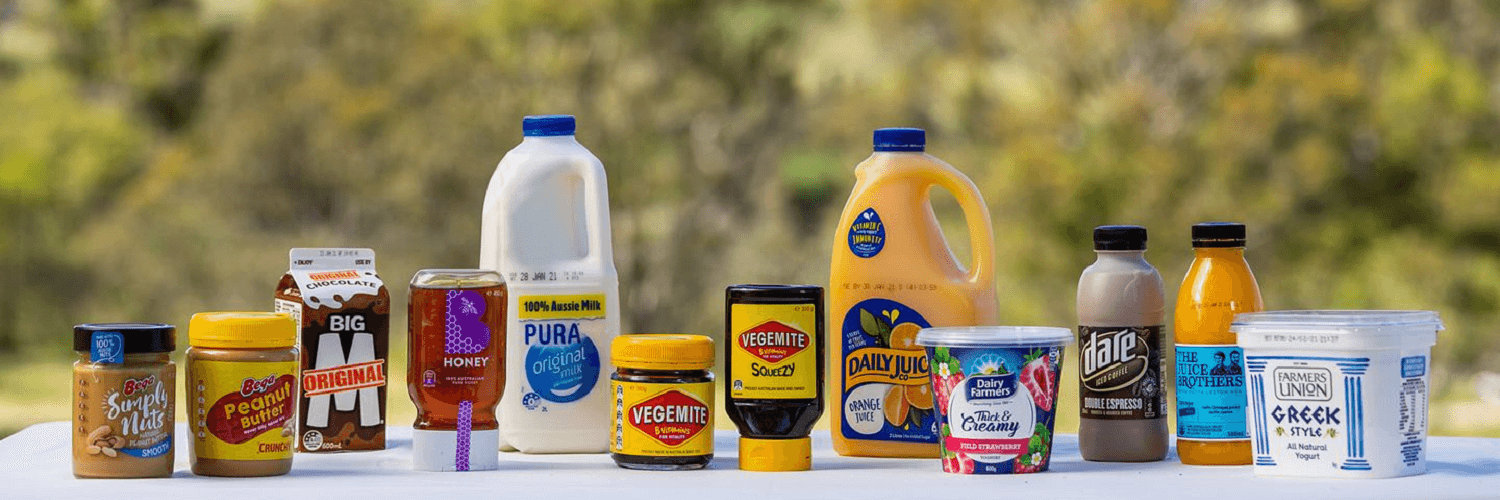
Bega Cheese Ltd. engages in processing, manufacturing and distributing dairy and associated products. The firm's products include Cheese, Spreads, Grocery, Bionutrients and Dairy. The firm's segments include Branded and Bulk. Its Branded segment is engaged in manufacturing bulk ingredients into consumer products for internal or external brands. Its Bulk segment is engaged in manufacturing of bulk dairy ingredients, nutritional and bio nutrient products. The firm also offers farm services, including milk supply agreements and milk supply agreement disputes. The firm's brands include Bega Cheese, Vegemite, Dare, Farmers Union, Dairy Farmers, Yoplait, B honey, Big M, Masters, Juice Brothers and Berri.
See Also
What is Bega Cheese Ltd's EPS (Diluted)?
EPS (Diluted)
0
AUD
Based on the financial report for Dec 28, 2025, Bega Cheese Ltd's EPS (Diluted) amounts to 0 AUD.
What is Bega Cheese Ltd's EPS (Diluted) growth rate?
EPS (Diluted) CAGR 10Y
-14%
Over the last year, the EPS (Diluted) growth was -73%. The average annual EPS (Diluted) growth rates for Bega Cheese Ltd have been 44% over the past three years , -28% over the past five years , and -14% over the past ten years .
