Amazon: Business Overview


Amazon is a global leader in e-commerce, cloud computing, digital advertising, and AI-driven services, with key businesses like AWS, the Amazon marketplace, and Prime. AWS dominates the cloud market with a 32% share, while Amazon expands its AI capabilities through custom chips, AI-powered shopping, and generative AI in AWS. With continuous innovation in cloud, logistics, and AI, Amazon remains at the forefront of digital commerce and enterprise technology.
INVESTMENT THESIS
Amazon is one of the world's largest technology and e-commerce companies, operating across online retail, cloud computing, digital advertising, and AI-driven services. Its core businesses include the Amazon marketplace, Amazon Web Services (AWS), Prime membership ecosystem, and smart devices like Alexa.
AWS remains the leading global cloud provider with a 32% market share, powering a significant portion of the internet and enterprise AI workloads. Amazon is also expanding its AI capabilities through custom chips like Trainium and Inferentia, AI-powered shopping tools, and generative AI integrations across AWS.
With strong growth in cloud computing, logistics innovations, and AI advancements, Amazon continues to shape the future of digital commerce and enterprise technology.
ECONOMIC MOAT
Amazon has a WIDE ECONOMIC MOAT, ensuring long-term competitive advantage and sustained profitability across its key industries. This moat is driven by its dominance in e-commerce, leadership in cloud computing through AWS, and deep integration of AI across retail, logistics, and enterprise services.
Amazon’s vast scale, proprietary logistics network, and Prime ecosystem create high barriers to entry, while its continuous investment in AI and automation strengthens operational efficiency and customer retention. These factors collectively reinforce Amazon’s market leadership, securing its long-term profitability and stock growth potential.
1. Market Dominance in E-Commerce.
Amazon leads the global e-commerce market, benefiting from massive scale, logistics efficiency, and Prime membership, which enhances customer loyalty. Its vast product selection and fast delivery create high switching costs, discouraging customers from migrating to competitors.
2. AWS Leadership in Cloud Computing.
Amazon Web Services (AWS) is the largest cloud provider, contributing significantly to Amazon’s profitability. With over 31% market share, AWS benefits from economies of scale, deep customer integration, and continuous innovation in AI, machine learning, and enterprise solutions.
3. Extensive Logistics and Fulfillment Network.
Amazon’s fulfillment centers, last-mile delivery services, and growing drone and automation capabilities provide a significant cost and speed advantage. This infrastructure makes it difficult for competitors to match Amazon’s efficiency, reinforcing its dominance in retail and third-party marketplace services.
4. Subscription and Ecosystem Lock-In.
Amazon Prime, with over 200 million subscribers, strengthens customer retention through bundled benefits like free shipping, streaming content, and exclusive deals. Additionally, Alexa, Kindle, and Fire TV create an integrated ecosystem that keeps users engaged within Amazon’s platform.
5. Investment in AI and Automation.
Amazon continues to innovate in AI-powered recommendations, warehouse robotics, and generative AI tools for AWS clients. These advancements enhance efficiency, improve customer experiences, and solidify Amazon’s leadership in both retail and cloud computing.
BULL AND BEAR THESES
A slowdown in AWS revenue growth combined with persistently thin margins in the retail segment may suppress overall profitability, undermining Amazon’s ability to fund strategic ventures.
Amazon Web Services continues to be a high-margin, market-leading cloud platform, providing a crucial profit engine that funds reinvestment across the entire organization.
PRODUCT OFFERING
1. Hyperscalers Infrastructure: AWS
AWS is the largest cloud computing provider, holding 32% market share as of 2024, offering scalable infrastructure, AI, and analytics solutions.
- Comparison: Microsoft Azure (22%) and Google Cloud (13%) follow, with Azure excelling in hybrid solutions and Google Cloud leading in AI research.
- Competitive Edge: AWS’s first-mover advantage, broadest service portfolio, and deep enterprise adoption solidify its leadership.
2. E-Commerce Marketplace: Amazon Marketplace
Amazon dominates global e-commerce with a 37.6% market share in the U.S., offering millions of products and a vast third-party seller network.
- Comparison: Walmart (6.8%) and eBay (3.5%) compete, but neither matches Amazon’s fulfillment speed, Prime benefits, and seller ecosystem.
- Competitive Edge: Advanced logistics, AI-driven recommendations, and the Prime membership program enhance customer retention.
3. Subscription Services: Amazon Prime
Amazon Prime has over 200 million subscribers, offering free shipping, exclusive deals, and streaming content.
- Comparison: Walmart+ competes with free shipping but lacks Amazon’s extensive media library. Netflix and Disney+ rival Prime Video but lack retail perks.
- Competitive Edge: A bundled approach combining retail, entertainment, and services fosters strong customer loyalty.
4. Digital Ads: Amazon Advertising
Amazon’s ad business generated over $47 billion in 2024, making it the third-largest digital ad player after Google and Meta.
- Comparison: Google dominates search ads, while Meta leads in social ads, but Amazon excels in commerce-driven advertising.
- Competitive Edge: High-intent audience and first-party shopper data enable superior targeting and conversion rates.
5. Smart Home Solutions: Alexa
Amazon leads the smart speaker market with a 60% share, thanks to Alexa-powered Echo devices and Fire TV.
- Comparison: Google Nest holds 30%, while Apple HomePod remains niche due to its premium pricing.
- Competitive Edge: Alexa’s deep integration with Amazon’s ecosystem, including shopping, smart home, and AI capabilities, enhances user engagement.
6. Logistics: Amazon Fulfillment
Amazon operates a global logistics network, handling over 75% of its U.S. deliveries, reducing reliance on third parties like UPS and FedEx.
- Comparison: Walmart and Target are expanding fulfillment capabilities but still depend on external carriers.
- Competitive Edge: Proprietary warehouse automation, last-mile delivery, and drone initiatives ensure faster and cheaper shipping.
FINANCIAL RESULTS
1. Revenue Growth.
Amazon's revenue has grown at a compound annual growth rate (CAGR) of approximately 15% over the last five years, fueled by the expansion of Amazon Web Services (AWS), e-commerce, and digital advertising. While slightly behind Alphabet's 16% CAGR, Amazon's growth remains ahead of the broader tech sector's 9-10% CAGR. The company's diversification into high-margin segments like cloud computing and advertising has helped sustain its revenue expansion despite e-commerce fluctuations.
2. Operating Income.
Amazon's operating income has increased at a CAGR of 19%, driven primarily by the high-margin AWS division, which contributes the majority of its profits. Unlike competitors like Microsoft (17%) and Alphabet (15%), Amazon has historically operated on thinner margins due to its low-margin retail business, but cost-cutting initiatives and automation investments have improved profitability. The company's focus on efficiency in fulfillment and logistics has further supported margin expansion.
3. Net Income and EPS Growth.
Amazon’s net income grew at a CAGR of 22%, outpacing the sector average of 12-14%. This improvement has been driven by AWS growth, advertising expansion, and operational efficiencies. However, compared to Microsoft and Apple, which benefit from more stable profit margins, Amazon's earnings remain more volatile due to cyclical shifts in consumer spending. The company’s EPS growth has also been amplified by strategic capital allocation and reinvestment into high-margin businesses.
4. Free Cash Flow (FCF).
Amazon has demonstrated strong free cash flow (FCF) generation, with a CAGR of 16%, reflecting improved operational efficiency and lower capital expenditures in fulfillment infrastructure. While still trailing Microsoft’s 17% FCF CAGR, Amazon’s focus on expanding AWS, optimizing logistics, and growing advertising revenue has significantly enhanced its cash flow generation. This positions Amazon for continued reinvestment into AI, cloud, and automation technologies, ensuring long-term scalability and profitability.
5. Margins and Return Metrics.
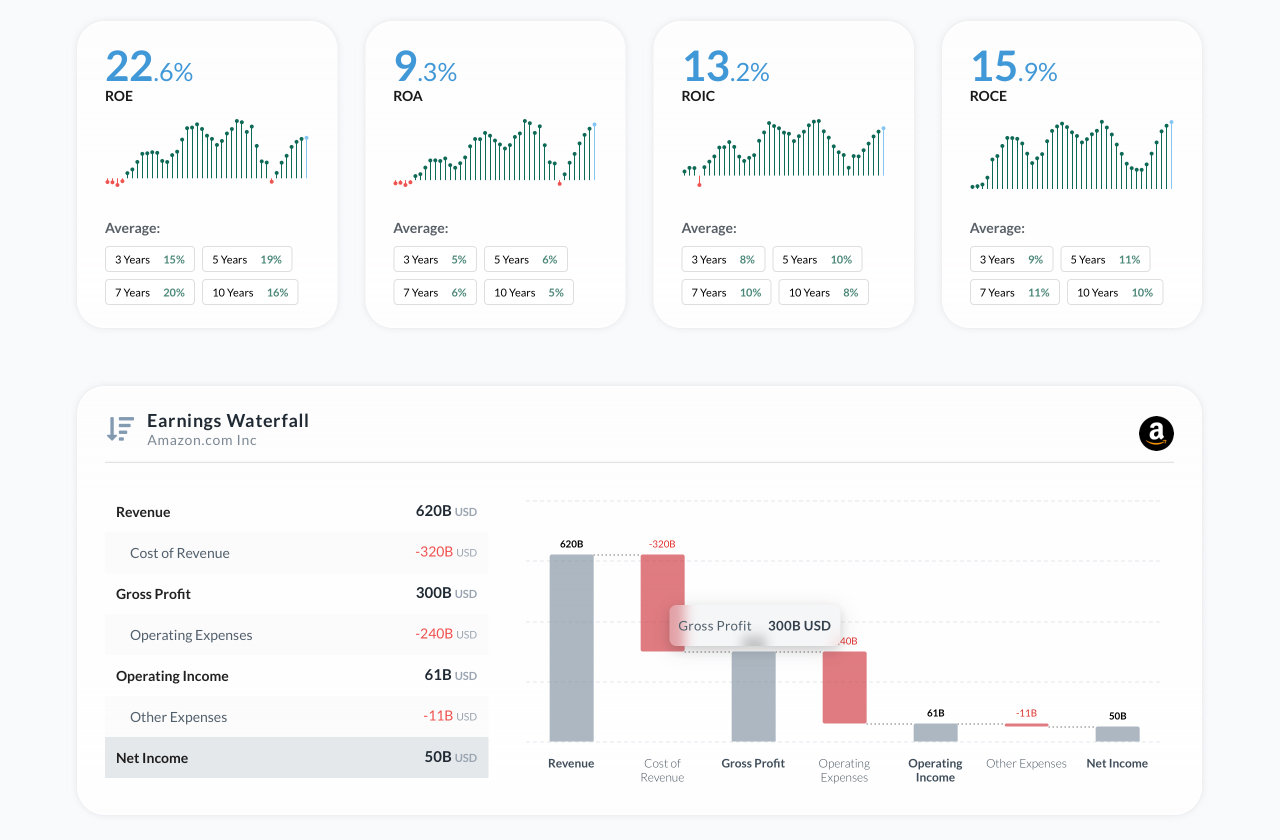
- Gross Margin: Amazon's gross margin reached 46% in 2024, steadily improving due to growth in AWS and advertising, yet below software-heavy peers like Microsoft (68-70%).
- Operating Margin: Increased to 10.5% in 2024, up from 9% in the previous year, driven by efficiency improvements and AWS profitability, though still lower than Alphabet (31%) and Microsoft (44%).
- Return on Equity (ROE): Amazon’s ROE rose to 24%, reflecting strong earnings growth, but remains slightly below the 27% S&P 500 average due to reinvestment-heavy operations.
- Return on Invested Capital (ROIC): Improved to 13% in 2024, well above retail sector norms but lower than tech-focused giants like Microsoft (26%), as Amazon continues expanding logistics and AI investments.
SHAREHOLDERS RETURNS
Dividends
Amazon has historically focused on reinvesting profits into growth rather than paying dividends, prioritizing expansion in e-commerce, cloud computing, and AI. Unlike Microsoft, Amazon has yet to initiate a dividend program, instead utilizing its strong free cash flow for strategic investments, acquisitions, and infrastructure development.
Given Amazon’s continued profitability and maturing business segments, analysts speculate that the company may introduce dividends in the future, particularly as its cash flows from AWS and advertising continue to scale.
Share Repurchases
Amazon has also been actively repurchasing its stock as part of its capital allocation strategy. Over the past five years, the company has spent billions on share buybacks, leveraging its strong cash flow to reduce outstanding shares and enhance earnings per share (EPS). In FY 2024, Amazon repurchased approximately $12.8 billion worth of its own shares, reflecting confidence in its long-term growth. As of early 2025, Amazon still has around $23 billion remaining under its approved buyback authorization.
These share repurchases not only boost shareholder value but also indicate management’s optimism about Amazon’s financial health and future prospects. By complementing reinvestments in AWS, AI, logistics, and advertising with stock buybacks, Amazon balances growth initiatives with shareholder returns.
Shareholder Return Yield Over the Last 5 Years
Amazon’s total shareholder return (TSR) over the last five years, which includes capital appreciation but excludes dividends (since Amazon does not pay them), has been strong but volatile. Between 2019 and 2024, Amazon delivered an average annual TSR of approximately 18-20%, driven by its dominance in e-commerce, AWS growth, and expansion into AI and advertising.
Comparison to Industry and S&P 500
- Technology Sector: The average TSR for the technology sector has been around 20-22%, with cloud and AI companies driving growth. While Amazon’s TSR is in line with the sector, it trails dividend-paying giants like Microsoft but outperforms companies undergoing heavy reinvestment phases.
- S&P 500: The broader S&P 500 has delivered an average TSR of 12-14%, meaning Amazon has outpaced the market, thanks to its leadership in e-commerce, AWS expansion, and digital advertising growth.
- Peers: Compared to Microsoft (~24-25%) and Alphabet (~17-19%), Amazon’s TSR has been competitive but influenced by macroeconomic conditions, consumer spending cycles, and capital expenditures in fulfillment and logistics.
- Amazon’s long-term return potential remains strong, driven by AWS innovation, AI integration, Prime ecosystem expansion, and increasing profitability in advertising and logistics.
QUALITY OF EARNINGS
1. Revenue and Profit Sustainability
Amazon’s revenue generation is driven by its diversified business model, with key contributions from e-commerce, Amazon Web Services (AWS), advertising, and subscription services. This mix provides stability, balancing the lower-margin retail segment with high-margin businesses like cloud computing and digital advertising. In FY 2024, Amazon reported $590 billion in revenue, with AWS contributing $97 billion (16%), and advertising growing to $47 billion (8%), reflecting its increasing role in the company’s profitability.
Amazon’s operating margins have improved, particularly due to AWS and advertising, which carry significantly higher margins than traditional retail. In FY 2024, EBITDA margin reached approximately 17%, benefiting from cost efficiencies, automation in fulfillment centers, and AI-driven logistics. This steady expansion of high-margin revenue streams supports Amazon’s long-term growth and profitability while maintaining its leadership across multiple industries.
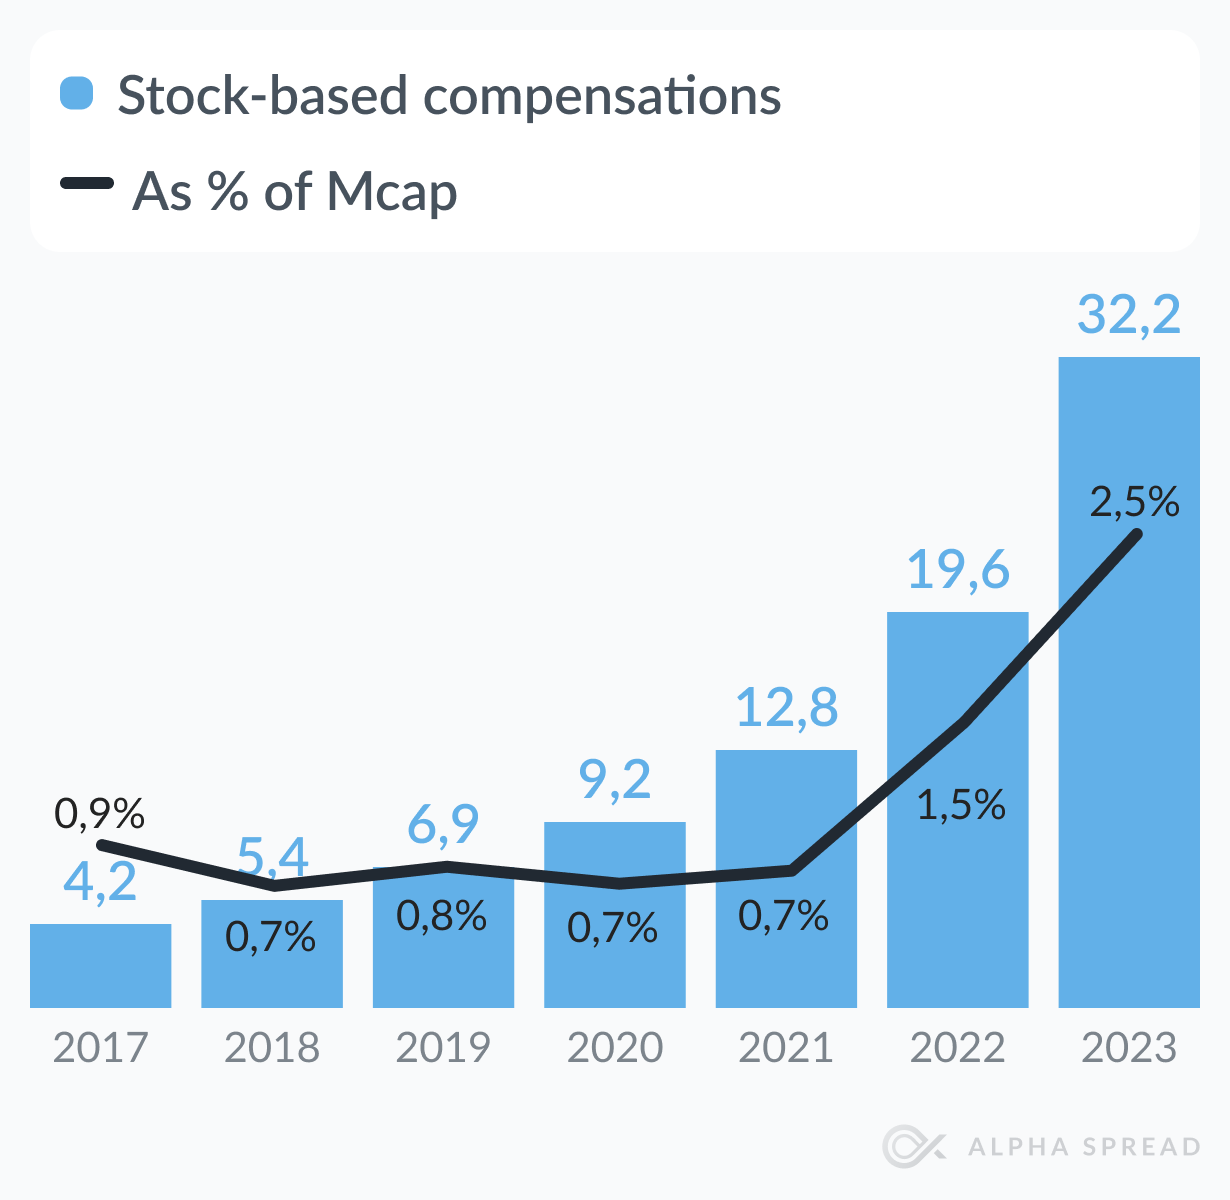
Amazon has historically issued higher levels of stock-based compensation (SBC) compared to many other tech giants, primarily to attract and retain top talent in cloud computing, logistics, and AI-driven innovation. Over the past five years, Amazon's SBC as a percentage of market capitalization (MCap) has averaged around 3% – 4% annually, reflecting its reliance on equity-based incentives.
Despite its higher SBC levels, Amazon has managed strong revenue and cash flow growth, allowing it to sustain employee incentives while continuing to invest in long-term innovation.
Comparison with Competitors:
- Apple and Alphabet (Google) report lower SBC ratios, averaging 1.2% and 1.8% of MCap, respectively, as they rely more on cash-based compensation.
- Meta has historically maintained similar SBC levels to Amazon, around 3% – 4%, particularly in AI and metaverse-related hiring.
- Microsoft’s SBC is lower at 0.5% of MCap, reflecting a more balanced compensation strategy that includes competitive salaries alongside equity grants.
Comparison with S&P 500:
- The broader S&P 500 average SBC-to-market-cap ratio is around 0.5% – 1%, with most non-tech companies offering fewer stock-based incentives.
- Amazon’s higher SBC reflects its aggressive talent acquisition strategy, particularly in AWS, AI, and fulfillment automation, where skilled professionals command premium compensation.
2. Free Cash Flow (FCF)
Amazon's free cash flow (FCF) generation underscores its strong financial health. The company generated $43 billion in FCF for FY 2024, resulting in an FCF margin of around 15%.
Amazon’s FCF quality is further bolstered by its minimal debt and efficient reinvestment strategy, focusing on growth opportunities while maintaining a low risk of financial instability. The company has consistently reinvested its profits to expand its market share and improve operational efficiencies, positioning itself for sustainable long-term growth.
SENTIMENT
The sentiment towards Amazon (AMZN) is strongly bullish, with 65% of users on the Alpha Spread platform expressing a positive outlook, while 20% maintain a neutral stance. The bullish sentiment is fueled by Amazon’s impressive financial performance, driven by its dominant position in e-commerce, cloud services (AWS), and subscription offerings like Amazon Prime. Investors are particularly optimistic about Amazon's long-term prospects due to its leadership in cloud computing, continued growth in retail, and the expanding reach of its advertising business.
The company’s diversified revenue streams, including AI innovations through Alexa and Prime Video, as well as its massive logistics and fulfillment network, further bolster investor confidence. Amazon’s ability to innovate across various sectors continues to reinforce its strong position in the market.
BUSINESS COMPOSITION
| Segment | Share |
|---|---|
|
%
|
|
|
%
|
|
|
Online Stores
40.9%
|
|
|
%
|
|
|
Physical Stores
3%
|
|
|
%
|
|
|
Third-Party Seller Services
25.3%
|
|
|
%
|
|
|
Advertising Services
9.2%
|
|
|
%
|
|
|
Subscription Services
6.1%
|
|
|
%
|
|
|
AWS
15.3%
|
|
|
%
|
|
|
Other
0.2%
|
|
|
%
|
|
CONCLUSION
Amazon presents a compelling investment case due to its dominance in cloud computing, e-commerce, and artificial intelligence. Its ability to innovate and scale across multiple industries has solidified its position as a market leader, ensuring long-term growth potential. The company's vast ecosystem, ranging from retail to digital services, provides a competitive edge that continues to attract both consumers and businesses.
A key driver of Amazon’s financial strength is its AWS platform, which generates substantial and recurring revenue. This division not only delivers high margins but also serves as a stable foundation for the company’s diversified business model. Additionally, the Amazon Prime subscription service fosters customer loyalty, driving consistent cash flow and reinforcing the company's leadership in e-commerce.
Despite these strengths, we maintain a HOLD rating on Amazon stock with a $251 price target. While we recognize its strong fundamentals and sustained premium valuation, current market conditions and potential regulatory challenges warrant a balanced approach. Investors should consider both the company’s long-term growth prospects and short-term uncertainties when evaluating their position.

Dr. Viktor Kalm is a Senior Investment Analyst at Alpha Spread. He has over seven years of experience in corporate finance, specializing in financial modeling, business valuation, and strategic planning services. Previously, as a hedge fund manager, he focused on private equity management, consistently delivering positive returns to his clients.
Dr. Viktor Kalm is a Senior Investment Analyst at Alpha Spread. He has over seven years of experience in corporate finance, specializing in financial modeling, business valuation, and strategic planning services. Previously, as a hedge fund manager, he focused on private equity management, consistently delivering positive returns to his clients.


 You don't have any saved screeners yet